


Let us help you get your project done
We’re excited to hear your project.
Let’s collaborate!
Not sure? Call us (416) 243-2431.

It often happens, when you are developing a new product with your Drupal installation or trying some new features that you installed, or even if you are attempting to update the Drupal core and suddenly you hit the WSOD, or White Screen of Death, and you are lost at words and don’t know what to do, but…let’s just not worry for now, hitting a WSOD doesn’t necessarily mean that your whole site is totally broken, there are many reasons why this could happen and the fix could be simply clearing the internal cache or sometimes extra debugging techniques will be needed to catch the error.
We have previously covered some of the top Drupal debugging techniques before, but in this article we will cover some of the most common Drupal troubleshooting techniques for finding and fixing some common issues, and also we will explore the use of the PHP Module XDebug to inspect the execution process of your Drupal installation and find some trickier bugs.
As always, at OPTASY we have experience debugging complex Drupal applications and we are here to help should you encounter any issues with your website.
Hi there ! I'm Daniel Rodriguez, a senior Drupal developer at OPTASY with over a decade of experience building Drupal websites. I've successfully helped troubleshoot many issues of our client’s website by using some of the information I’ll provide in this blog article today.
We can’t stress enough how important it is to have drush installed in your project, drush is a command-line interface for Drupal, and you’ll use it to perform most of the admin tasks that you would normally perform from the Drupal Admin pages. We usually use drush uli to look into the database logging records when the WSOD prevents you to access any section of the site:
You can also use drush to clear cache, execute PHP code, and also to get access to the DB CLI interface, so please, make sure your project has this installed and reject any hosting providers that don’t give you access to such tools.
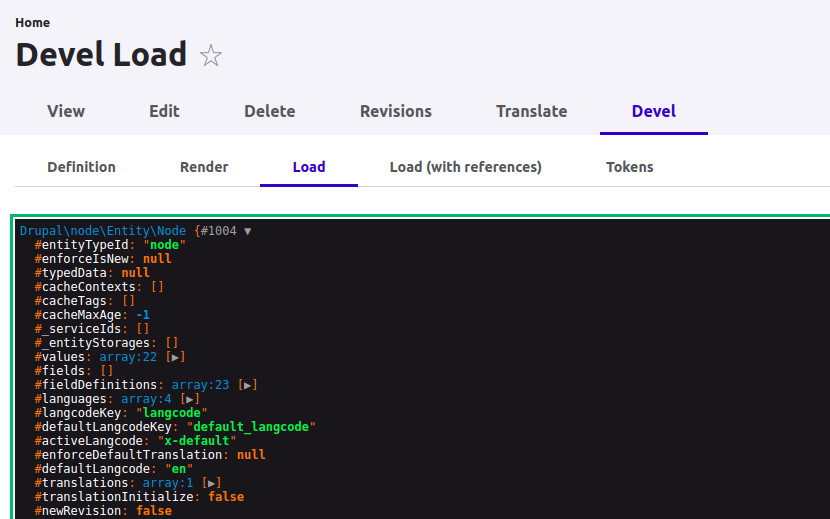
This classic module for Drupal developers provides helper PHP functions and informative debug pages that can be used to display content like entity metadata of the node page being displayed:
From the project’s page, here’s a list of some of the features that this module provides:
I love this module because it provides some helper functions that are very useful for debugging classes, hooks and template files, in this sample code I use the helper function dpm() to output the value of a variable to see why there is an error when running a process from this form:
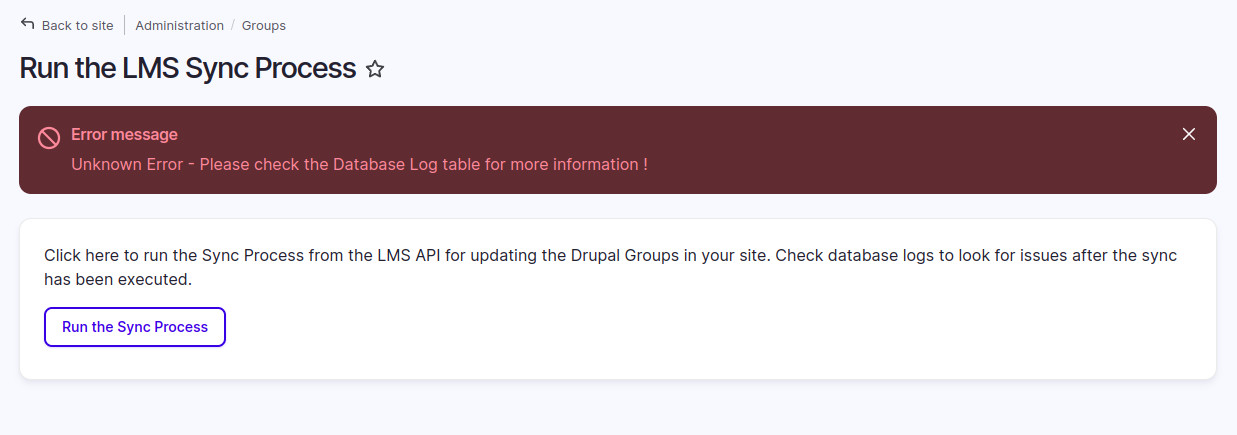
Using the helper function to output the value of the $res variable:
 /**
  * {@inheritdoc}
  */
 public function submitForm(array &$form, FormStateInterface $form_state) {
   $res = $this->api->syncUsersToGroups();
   dpm($res);
   if ($res) {
     $this->messenger->addMessage($this->t('Synced users/group from the LMI Endpoint ! ' . $this->api->getAPIEndpoint()));
   } else {
     $this->messenger->AddError($this->t('Unknown Error - Please check the Database Log table for more information !'));
   }
 }
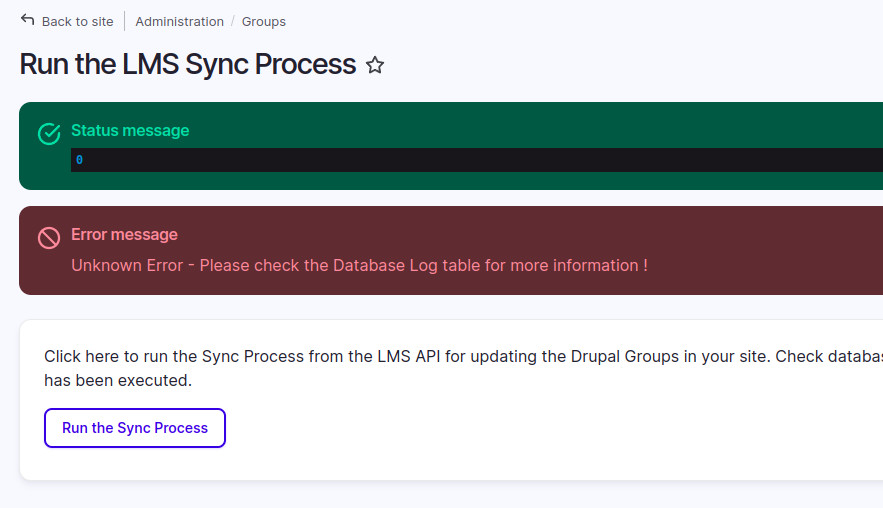
This will display a status message (with green background) with the variable’s value, this will give us some hints of why the process is not working and how to fix it:
If you are getting a WSOD (White Screen of Death) when displaying a few or all of the pages of your website:
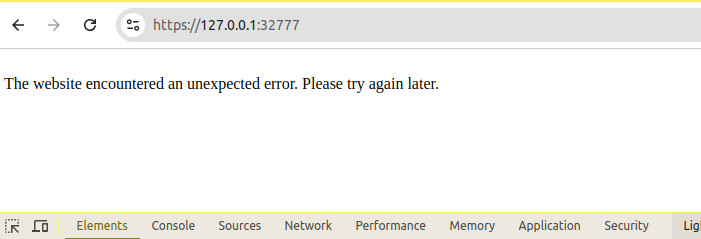
Or if you are getting a few alerts at the top of your page:
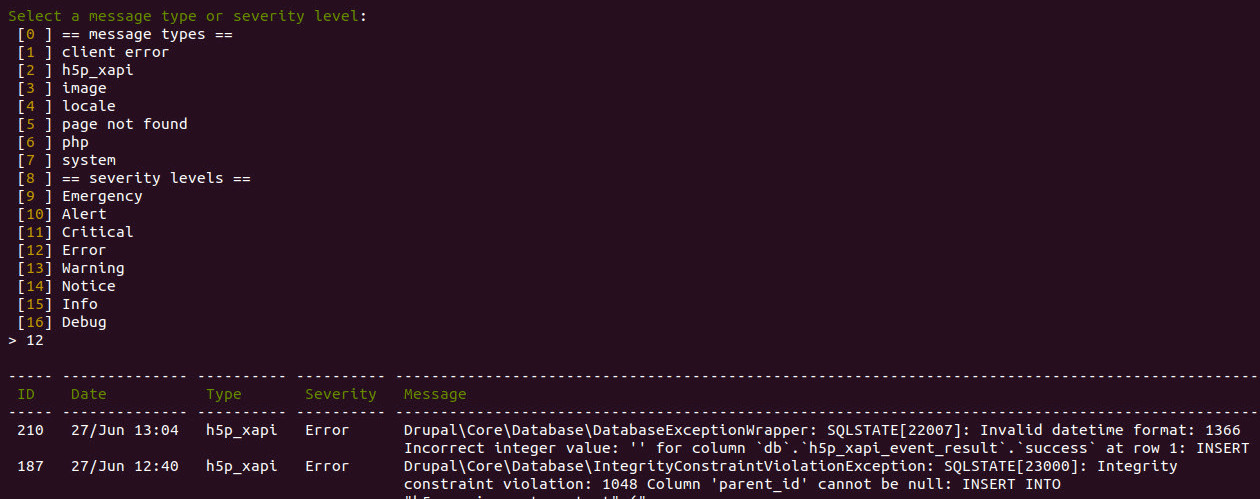
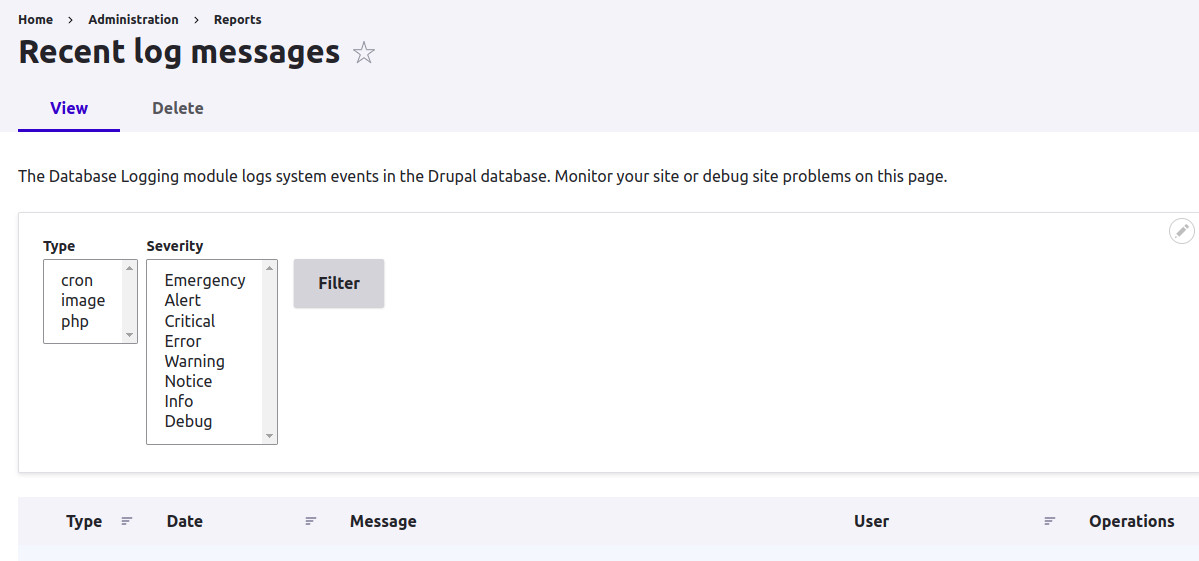
The first thing to look for is the “Recent log messages” page to check if the error was logged somewhere, you can do that from the Admin Menu by going to “Reports > Recent log messages” or by going to /admin/reports/dblog (make sure to enable the Core Database Logging module):
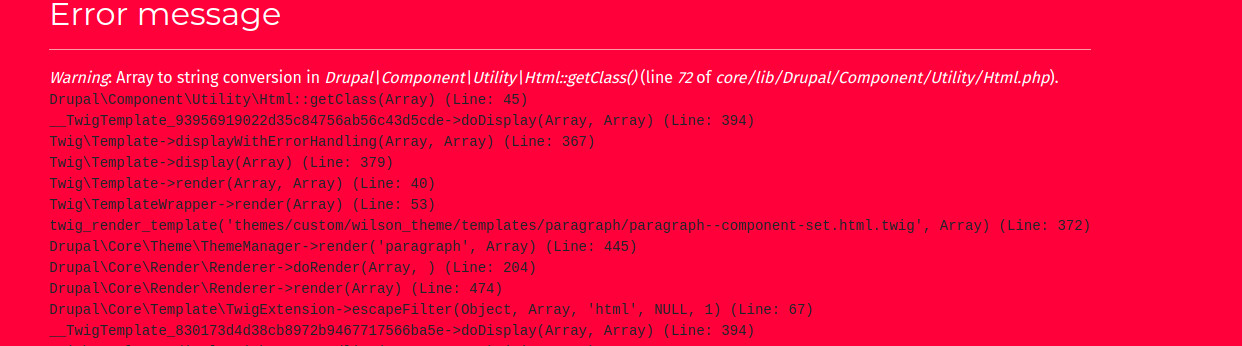
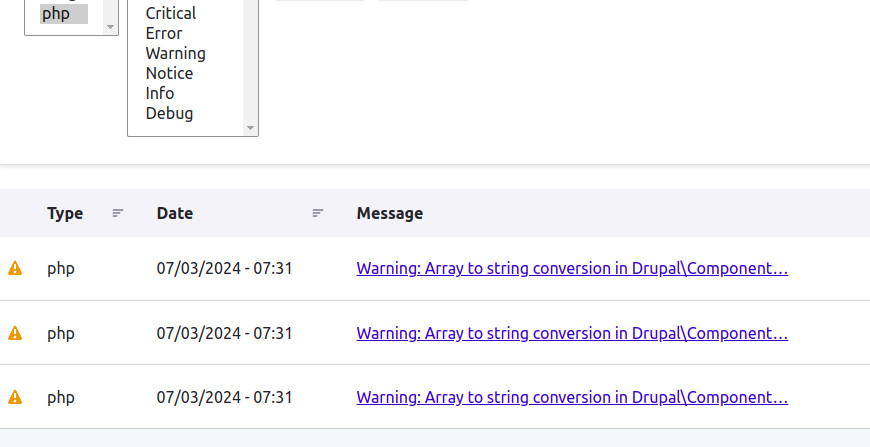
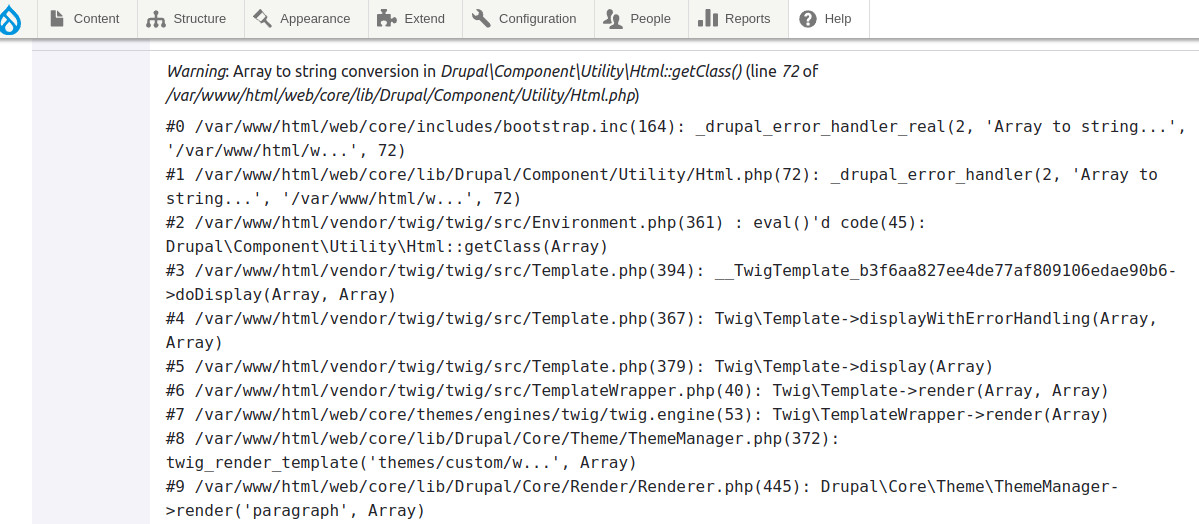
Check for the PHP error messages, you’ll see more details about the warning message:
Click on the link on the right, you’ll see more details about the PHP error message and the file involved:
This is a good starting point for fixing issues in your website, but if you are still running into errors that are preventing you to display pages, and nothing is being logged in the database logger table to give any hint on the issue, there’s still a few things you can do before doing any heavy-duty debugging:
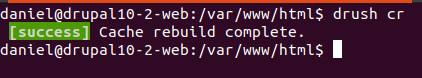
Clear Drupal Cache: There might be some old cached information, and when a request hits this cached information, there may be references to non-existent entities and this could trigger an 500 error, clearing cache could fix this:
Check Apache/NGINX/PHP errors: Sometimes many of these errors are not logged in the Drupal’s DB Logging table, but they are logged in the Apache or PHP log files, checking these files from time to time would be useful to catch some recurring errors in the site:
Here’s a list of common issues that could arise during the execution of your Drupal Application, check the links to the official Drupal pages with information for advices on how to fix these errors:
Still no luck finding the bug? Please check our guide for troubleshooting Drupal websites in 8 easy steps.
If none of the resources above help you in identifying the issue in your website, there’s still some things you can do to identify the evasive bug, but it involves some extra work and perhaps installing a few plugins/modules in your local environment, more on that below.
I personally like the XDEBUG + DDEV + IDE combo for doing debugging of Drupal websites in my local environment for many reasons, there’s plenty of debugging methods around for dissecting your Drupal website, but for the sake of simplicity, I’ll show you below how to use the XDEBUG + DDEV + VS Code (IDE) setup to debug your websites.
DDEV is an open source tool to launch web development projects in your local working computer, it is often used to run local PHP Applications like Drupal, but it also supports Node.js and Python applications.
DDEV runs on top of Docker, so you need to have it installed on your environment before you can install DDEV. The installation process of DDEV depends on what OS you are using, please refer to the official documentation for steps to install the application in your environment.
XDebug is a standard debugging tool for PHP, it provides not only step-debugging capabilities for your PHP application, but it also provides features such as stack traces, core dumping and more.
If you have installed DDEV, enabling XDebug is just as simple as running:
ddev xdebug on
From your local Linux/OSX/Windows terminal.
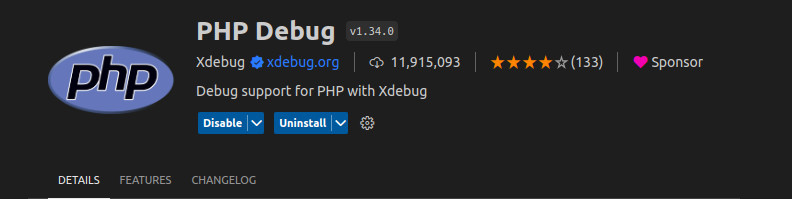
Then you will need to make sure that your IDE/Browser of choice will work with XDebug, I am using VS Code as my IDE and Google Chrome for all my browsing, so the next step is to install the PHP Debug plugin for VS Code:
And for your browser, you will need to install the Xdebug helper extension (if you have Chrome), this extension will pass all the debugging information from the site to XDebug for later debugging in your IDE, there is a similar plugin for Firefox as well:
Now that you have all the applications installed, let’s go back to VS Code, in the left sidebar there’s a bug icon in the middle of the toolbar, click on it:
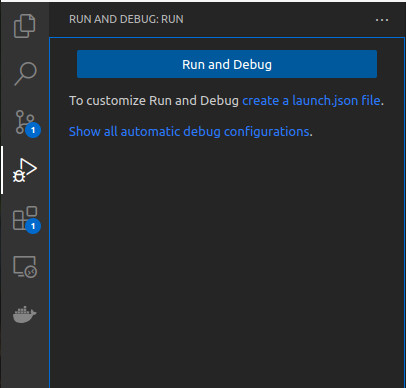
It instructs you to create a launch.json file in your project directory to customize your debugging environment, then click on the create a launch.json file link, this will create a new file with the default configuration for debugging, and since we are using ddev, replace the default configuration with this JSON snippet below:
{
   "version": "0.2.0",
   "configurations": [
     {
       "name": "Listen for XDebug",
       "type": "php",
       "request": "launch",
       "hostname": "0.0.0.0",
       "port": 9003,
       "pathMappings": {
         "/var/www/html": "${workspaceFolder}/",
       }
     }
as
   ]
  }
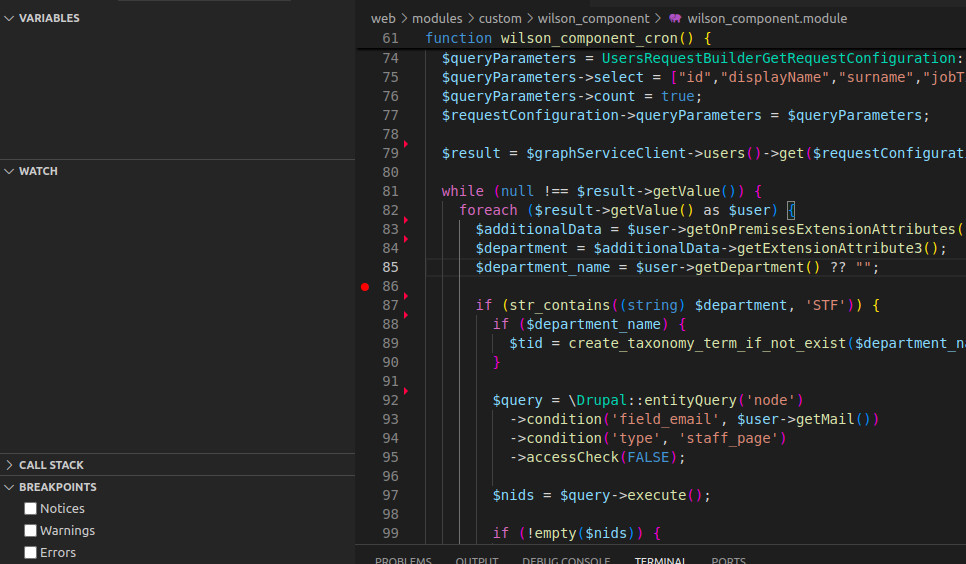
And save the file. Now we are ready to do some debugging, open the PHP file you want to inspect and start adding breakpoints as needed:
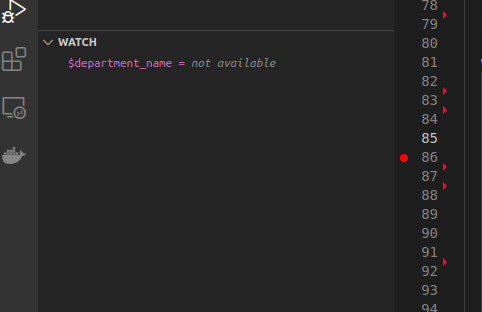
You can even add expressions to inspect variable’s contents in the “WATCH” box:
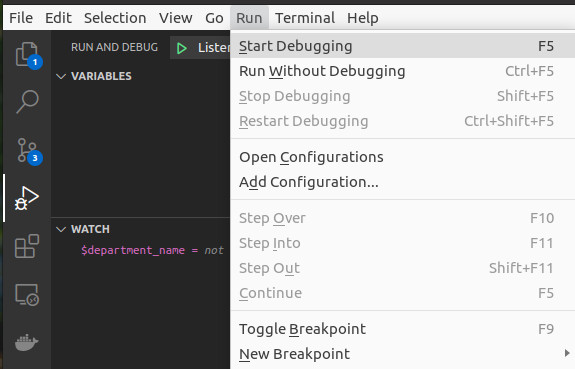
Now, from the main menu, go to “Run > Start Debugging”:
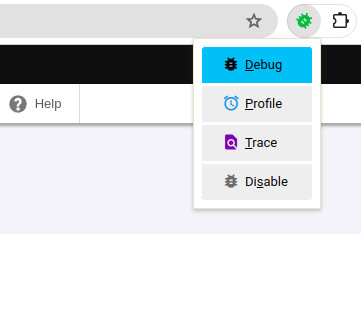
And finally, open in your browser the site you want to debug, but before that, in the same browser window/tab, open the extensions tool, click on the “Debug helper” extension, and it will display a toolbox, click on “Debug”, make sure it stays green:
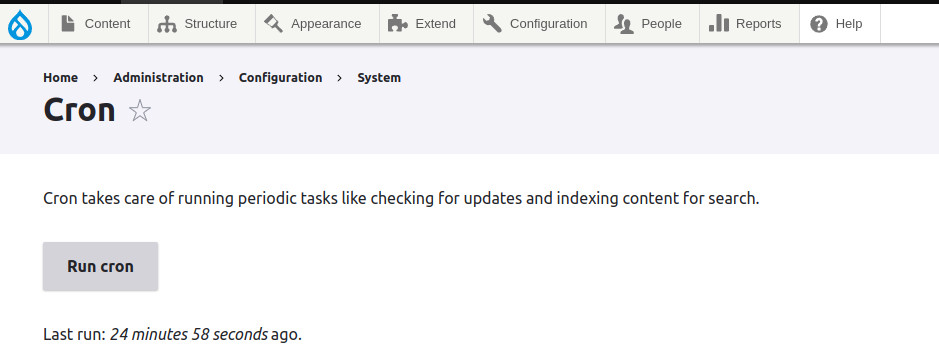
Open the local URL of the page you want to debug, in this example I’ll run the cron process at /admin/config/system/cron to debug a cron hook:
When the execution of the PHP code reaches the breakpoint you set before, the debug window of VS Code will be opened/focused to display the debug information at that point:
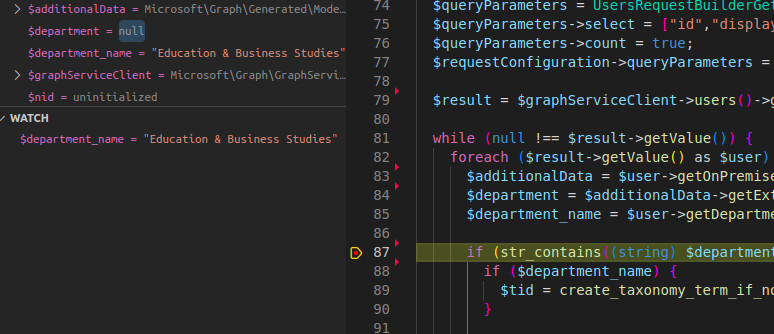
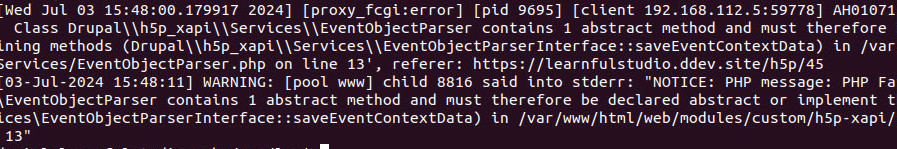
You can set as many breakpoints as you want, set breakpoints for warnings, errors or everything, in the example below, I set breakpoints when an exception is reached, in order to catch this elusive error that wasn’t logged anywhere:
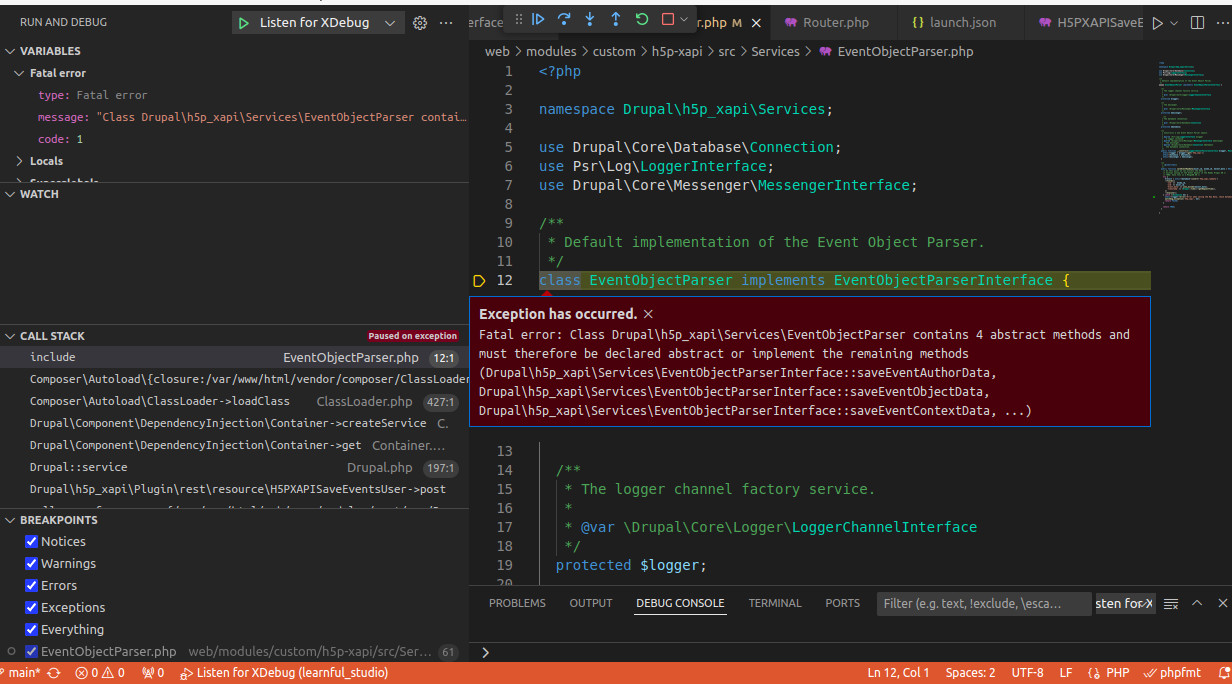
From the screenshot above we can see that we forgot to implement a few methods in the class file that were defined in the interface file, we fixed it by implementing the remaining methods.
XDebug is not only used for setting breakpoints, you can also watch variables, execute PHP expressions during the debugging process, analyze the call stack and many other features ! Please review the official documentation for more information.
I suggest installing this module if you want to quickly check how much PHP Memory is using your Drupal pages. This module logs, for each requested page, the PHP memory usage in the watchdog table:
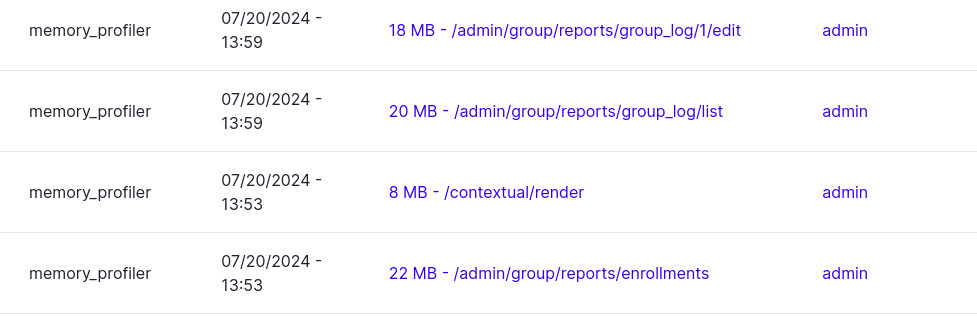
We often use this module to quickly check the PHP memory usage for the custom routes that we are implementing, and in some sites, we were able to improve page speed by 40% by just checking the memory usage for the main components of the sites and reduce unnecessary PHP code and API calls.
XDebug seems like a nice tool for debugging applications in your local/working environment, but what about your production site returning WSOD pages? You will need to rely on the tools installed in the live environment to debug this (you don’t have access to your IDE tools from the live server), here’s where the strace and tcpdump tools come in handy.
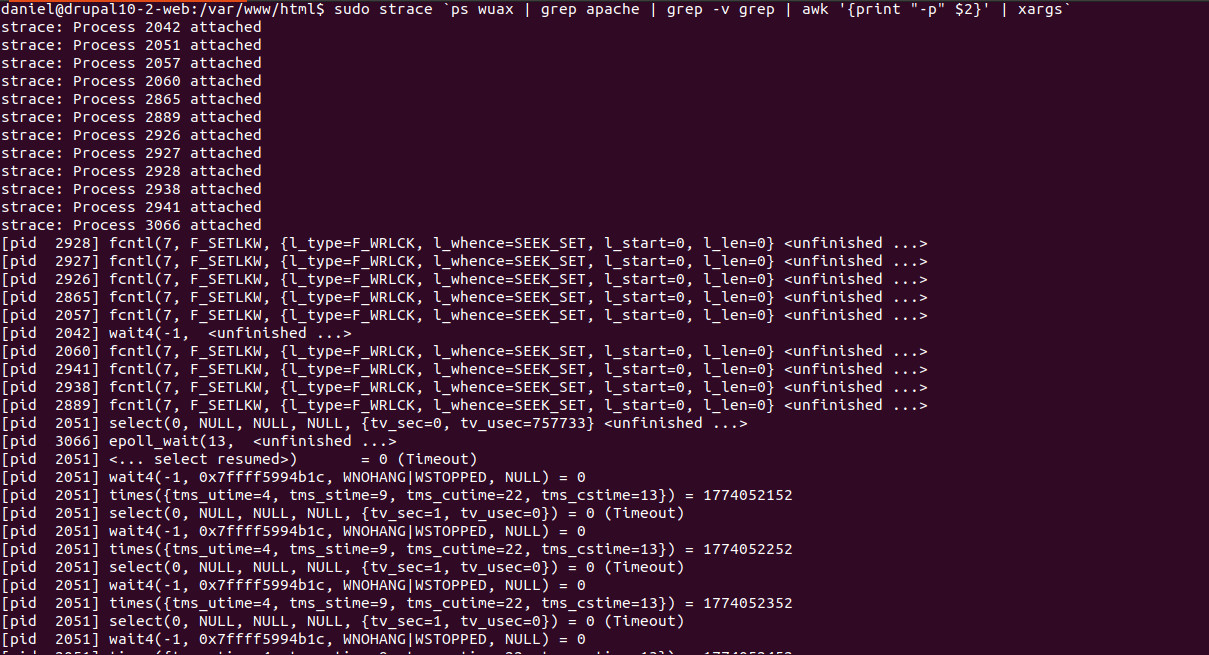
Strace is a debugging tool for Unix/Linux that I use for seeing the system calls and the UNIX signals that the web server is calling/processing, this is useful to pinpoint which system calls were executed or which files were read when the site hits the WSOD. We can start tracing all the apache/www requests with this command:
$ sudo strace `ps wuax | grep apache | grep -v grep | awk '{print "-p" $2}' | xargs`
We can see a lists of system calls during the execution of the Apache processes:
We can filter the results to match .module, .js and .include files only:
$ sudo strace -e trace=file -o/dev/stdout -f `ps wuax | grep apache | grep -v grep | awk '{print "-p" $2}' | xargs` | grep -we module -e js -e inc
We get similar results:
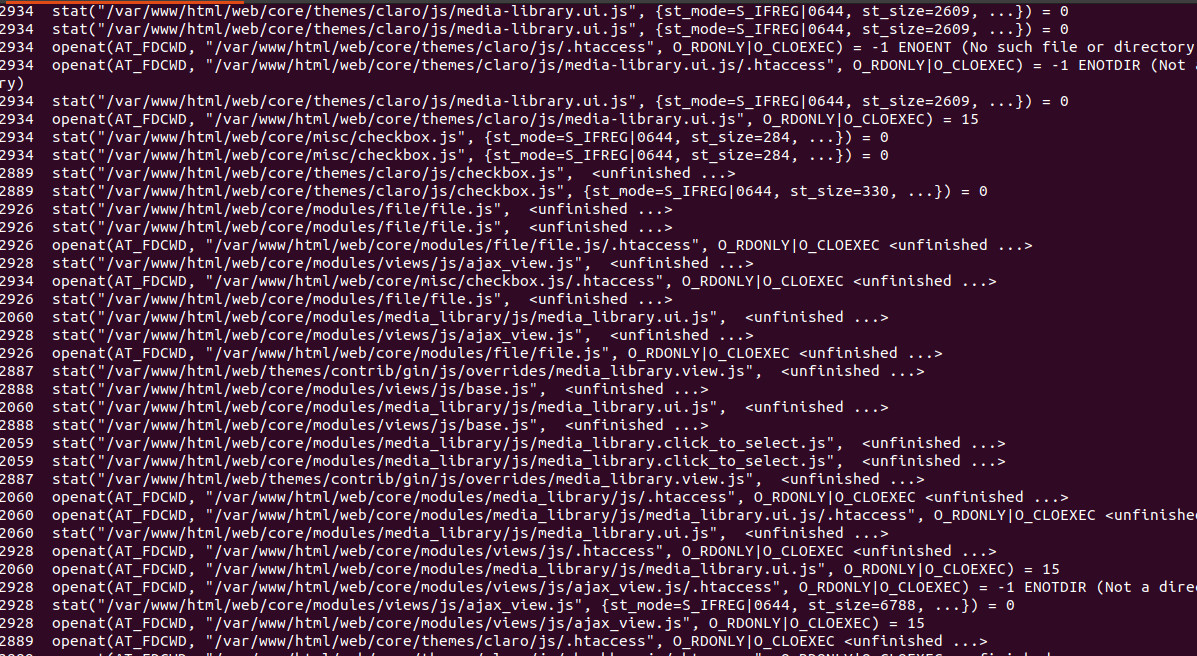
This tool alone won’t tell us exactly where the bug is located, but at least it will help us to identify which file is causing the problem. Please use this command in combination with other tools such as grep or awk to narrow down the results.
If you suspect your live server is having network issues (dropping packets) or the site is having issue processing cookies or GET/POST, you can use the tcpdump command to capture and analyze HTTP data:
$ sudo tcpdump -i eth0 port 80
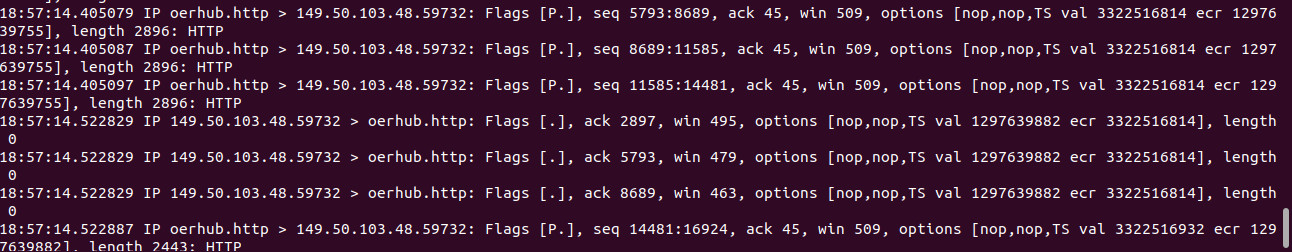
The command below will display the HTTP packets being captured with this tool, along with some other debugging TCP/IP information.
There is an excellent resource in the Drupal site with more information on how to use these two tools in many real-life scenarios, and how to debug other components of your Drupal site such as the DB and drush.
We have covered some common debugging techniques using the Devel module and more advanced debugging in your working environment using XDebug and how to use the strace and tcpdump Linux commands to do debugging in production servers.
Hopefully this article will help you in identifying the issues and how to spot and fix them. If you are having ongoing WSOD issues, please consider adquiring OPTASYS’ services for expert assistance. Don’t forget to take a look at our blog pages with lots of resources for Drupal Developers and Organizations.
We’re excited to hear your project.
Let’s collaborate!